


Netflix claimed the lion’s share of original streaming shows in North America that audiences expressed interest in watching, accounting for seven of the top 10 from January 1-August 31 2017.
Research compiled by Los Angeles-based data science company Parrot Analytics using its proprietary Demand Expressions metric reveals Netflix’s 13 Reasons Why (pictured) was the most in-demand show over the study period, registering roughly 5.25 Demand Expressions per 100 capita.
Demand Expressions quantify the weighted audience demand for a title across a range of platforms in a market, encompassing social media, video streaming, blogs, fan and critic rating platforms, peer-to-peer protocols, and file sharing sites.
The study, entitled ‘Mipcom 2017 Market Snapshot: North America’, placed Orange Is The New Black second on a fraction below four Demand Expressions per 100 capita, followed by Castlevania on roughly 3.5.
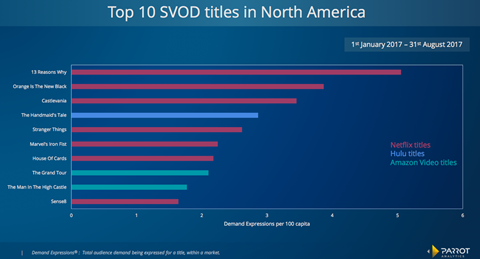
Hulu was the only non-Netflix show in the top five and secured fourth place on a fraction below three Demand Expressions per 100 capita for The Handmaid’s Tale – winner of eight Emmys last weekend including the first drama series win for a streaming original. Stranger Things rounded out the top five for Netflix on roughly 2.66.
Amazon had two shows in the top 10: The Grand Tour in eighth place on around 2.2 and The Man In The High Castle on roughly 1.8. Amazon founder Jeff Bezos wants a show on the level of HBO’s Game Of Thrones and has charged Amazon Studios chief Roy Price with strengthening the platform’s high-end drama pipeline.
Genre appeal
Turning to the genres that attract viewers to streaming originals, Parrot discovered drama was by far the preferred category. The genre is projected to claim 44.67% of total US demand by the end of 2017, followed by comedy on 25.35% share, action adventure on 9.29%, and animation on 6.27%.
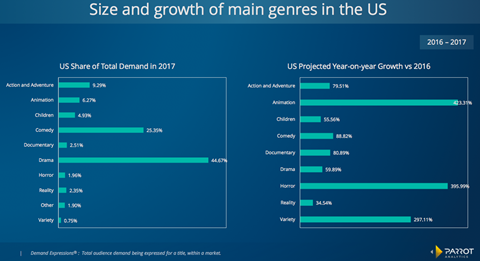
Animation and horror are the categories to keep an eye on and are projected to record the biggest year-on-year growth on 423.31% and 395.99%, respectively. After that comes variety shows, leaping 297.11% from 2016.
Seen through the lens of Demand Expressions over the period January 1-August 31 2017, drama over-indexed among viewers, scoring anywhere from 400 to more than 700 Demand Expressions per 100 capita. Comedy inhabited the 300-400 range, followed by action-adventure, which bar the odd spike resided in the 100-200 field.
Ranking fourth and fifth in the genre wars were animation and children’s content, neither of which registered much above roughly 80 Demand Expressions per 100 capita.
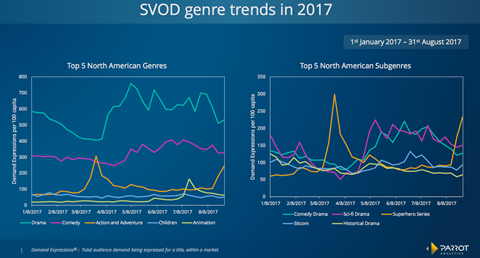
Turning to sub-genres, superhero shows spiked dramatically to 300 coinciding with the March 17 series premiere of Marvel’s Iron First on Netflix. However the sub-genre flattered to deceive and barring another spike in August that coincided with the premiere of Marvel’s The Defenders on Netflix, it tended to occupy the 50-100 range.
Sci-fi drama and comedy drama battled it out in the 100-200 range, followed by sitcoms and historical dramas that dwelled in the 50-100 field.


No comments yet